
Odin Performance Profiling via Spall
To do some simple performance profiling I used the Spall profiler which has client utils included in the Odin Core library at core:prof/spall. Using the example in the Odin docs was really quick and easy to setup in my application code. Then, the output file was easy to upload and read in the Spall web profiler.
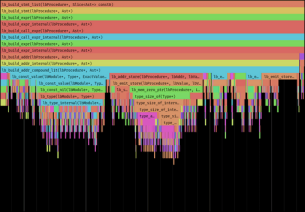
Since I am working on a simple application using Raylib I wanted to profile the amount of time my code spent running for each execution of the main loop (input, update, draw). See the gist or look below to see the util file prof.odin that I created which can just be copy-pasted into my project directory then just a few util functions added to my code to get the profiling working in just a couple of minutes.